
Hire Power BI Developers
for Trusted Analytics and Copilot Readiness
Softwarium builds Power BI dashboards, DAX models, embedded analytics, Azure-connected reporting pipelines, and governed semantic models. Business users gain Copilot ready consistent metrics, reliable reports, direct access to the data behind each result.
25+ Years in Software Engineering | 120+ Engineers |
Power BI Embedded Delivery | 300MB Excel Reporting Modernised
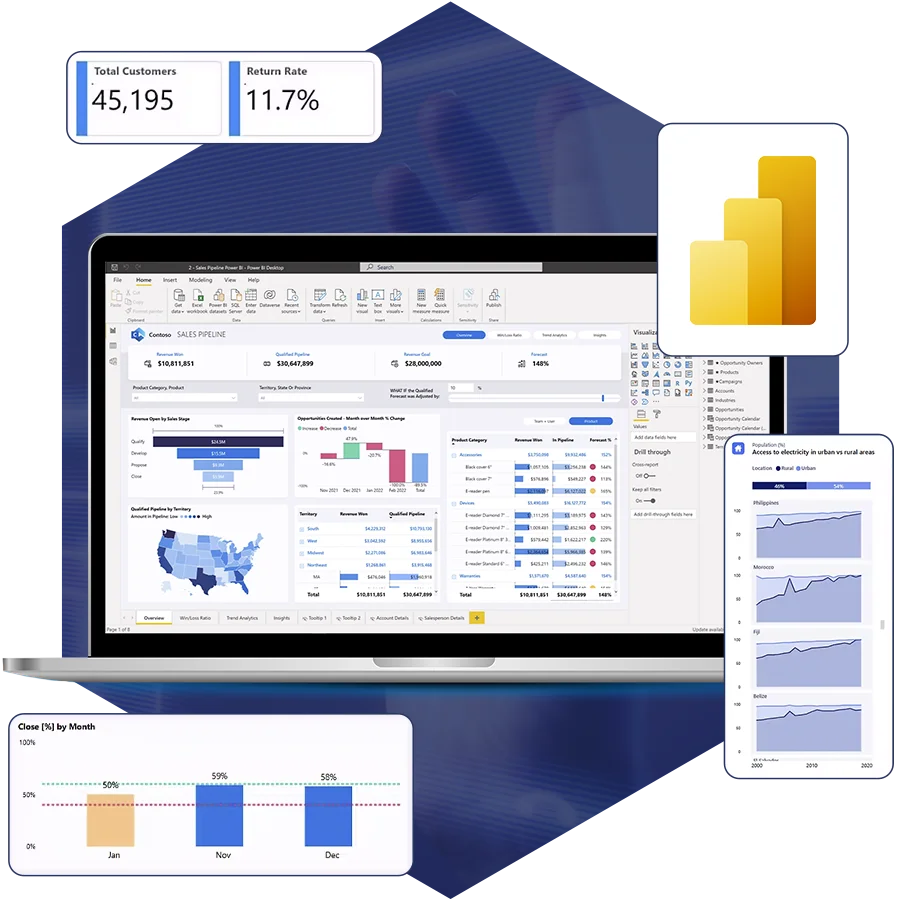
The Last Mile of AI Adoption
Data pipelines are running. Models are trained. Azure environments are provisioned. Business users still need a reliable way to see model outputs, inspect the supporting data, and connect each result to an operational decision. That handoff determines whether a prediction enters daily work.
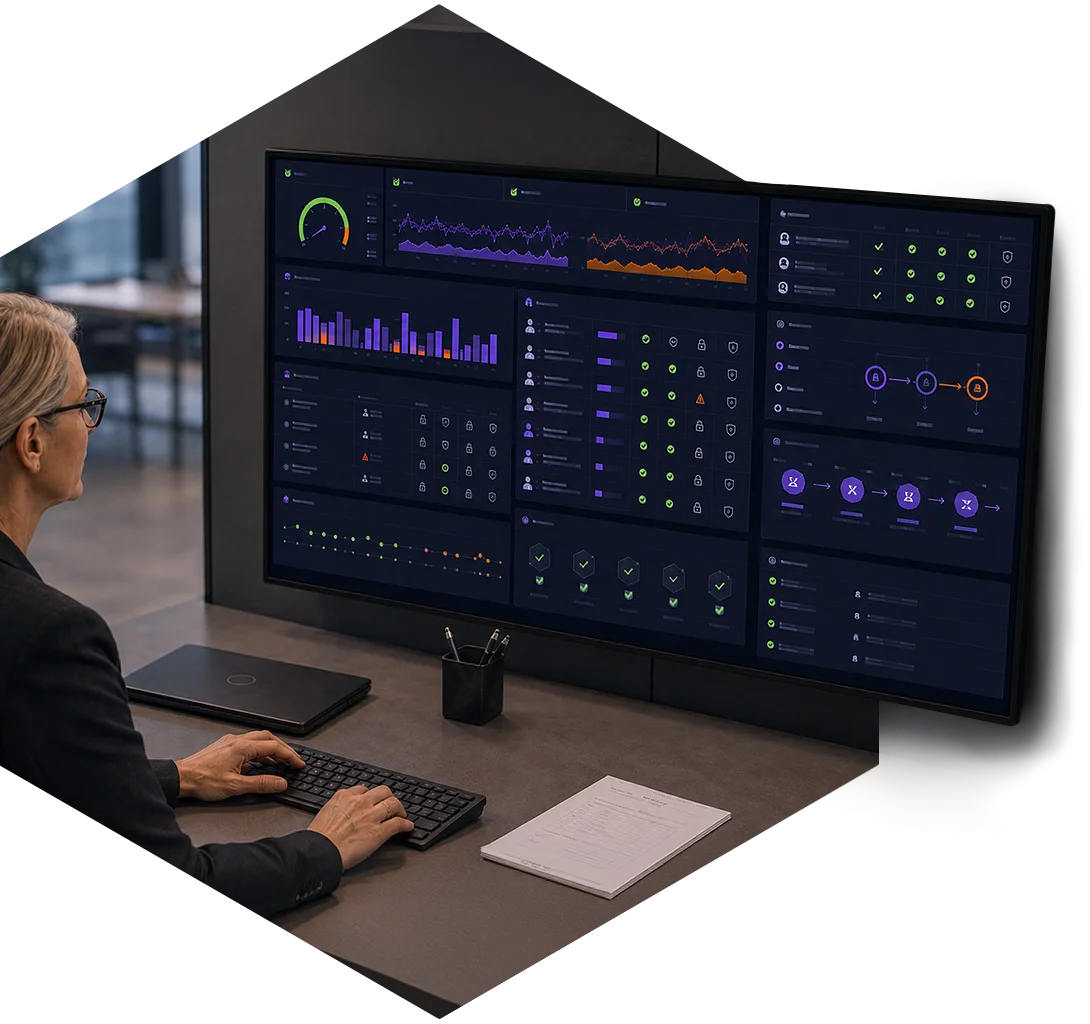
Power BI brings forecasts, scores, classifications, and anomaly flags into the reporting environment used by executives, analysts, and operations teams.

A demand forecast appears beside current stock, supplier lead times, and open orders. A risk score feeds an exception queue with the underlying records close behind it. An anomaly alert connects the signal to the transaction, asset, customer, or process that triggered it.
Softwarium builds the reporting layer, semantic model, data connections, security rules, and refresh processes behind that experience.
For Synovos, Softwarium replaced large Excel-based reports with Power BI dashboards and embedded reporting. Customers and managers gained clearer access to inventory, sales, lead, and departmental data.
The model is only as useful as the surface it reaches.

Power BI Problems Softwarium Developers Solve

Data lives across disconnected systems
Operational reporting draws data from SQL databases, Azure services, Dynamics 365, SharePoint, Salesforce, APIs, and file-based sources.
Softwarium connects these sources through structured pipelines and semantic models. Shared business definitions remain consistent across dashboards, departments, and reporting cycles.

Dashboards become slow or fragile in production
Production data exposes weak relationships, inefficient DAX, refresh bottlenecks, excessive visual queries, and unsuitable capacity configurations.
Softwarium reviews table relationships, model cardinality, DAX calculations, source queries, query folding, refresh logic, security rules, visual density, model size, capacity usage.
Reports are tested against real data volumes, access patterns, and user workflows.

Teams use conflicting versions of core metrics
Duplicated measures and unclear definitions create several versions of revenue, inventory, service performance, risk, and operational status.
Softwarium creates governed measures, shared terminology, model descriptions, and reusable semantic layers. Dashboards and Copilot draw from the same approved business logic.

Critical reporting depends on large Excel files
Large spreadsheets slow analysis, complicate distribution, and create conflicting report versions.
Softwarium migrates recurring Excel reporting into governed Power BI models with automated refresh, reusable measures, controlled access, and interactive dashboards.
Excel remains available for individual analysis. Power BI provides the shared reporting environment for recurring business metrics and operational views.

Machine learning outputs remain outside daily workflows
Forecasts, classifications, anomaly flags, and risk scores need context, traceability, and controlled access.
Softwarium connects model outputs to Power BI reports, KPI cards, exception queues, drill-through pages, alerts, and embedded analytics.
Users see each result beside the operational records, filters, timestamps, confidence values, and business thresholds that explain its relevance.

Copilot returns inconsistent answers
Copilot response quality depends on semantic-model structure, business terminology, metadata, security, and AI preparation settings.
Softwarium identifies unclear fields, ambiguous measures, missing descriptions, weak relationships, oversized schemas, security gaps, and high-value questions that require Verified Answers.
Power BI Development Services
Power BI dashboard development
Softwarium builds executive dashboards, operational reports, inventory views, sales reporting, departmental scorecards, service-performance dashboards, and exception-management interfaces.
Each report is shaped around:
the users who rely on it
the relevant access rules
the metrics involved
the source systems
the required refresh frequency
the decisions it supports
the actions that follow each insight
Visual design supports fast interpretation, drill-through analysis, and consistent use across teams.

DAX development and semantic modelling
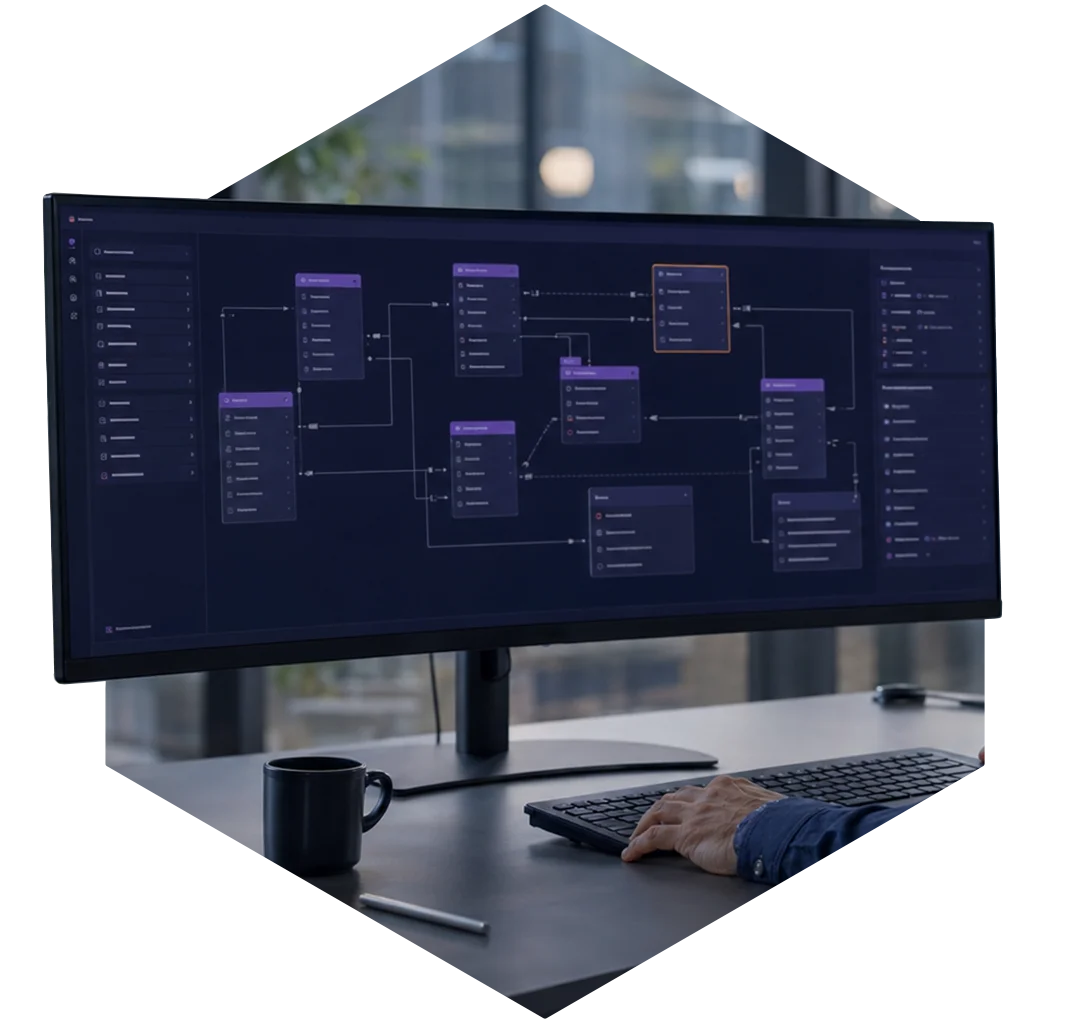
Reliable reporting starts inside the semantic model. Softwarium developers design:
star schemas
table relationships
calculation groups
hierarchies
reusable measures
time-intelligence logic
row-level security
object-level security
approved business definitions
Existing environments receive DAX optimisation, relationship correction, performance analysis, measure consolidation, and model documentation. Clear semantic models also improve natural-language interaction and Copilot response quality.
Power BI Embedded development
Softwarium embeds Power BI reports and analytics inside SaaS products, customer portals, internal applications, and operational platforms.
Delivery includes:
app-owned embedding
user-owned embedding
role-based access
Power BI REST APIs
Microsoft Entra ID integration
branded analytics experiences
tenant and customer separation
capacity planning
secure report distribution
responsive embedded layouts
The licensing and capacity architecture reflects the user group, embedding model, distribution requirements, and expected usage.
Excel-to-Power BI migration
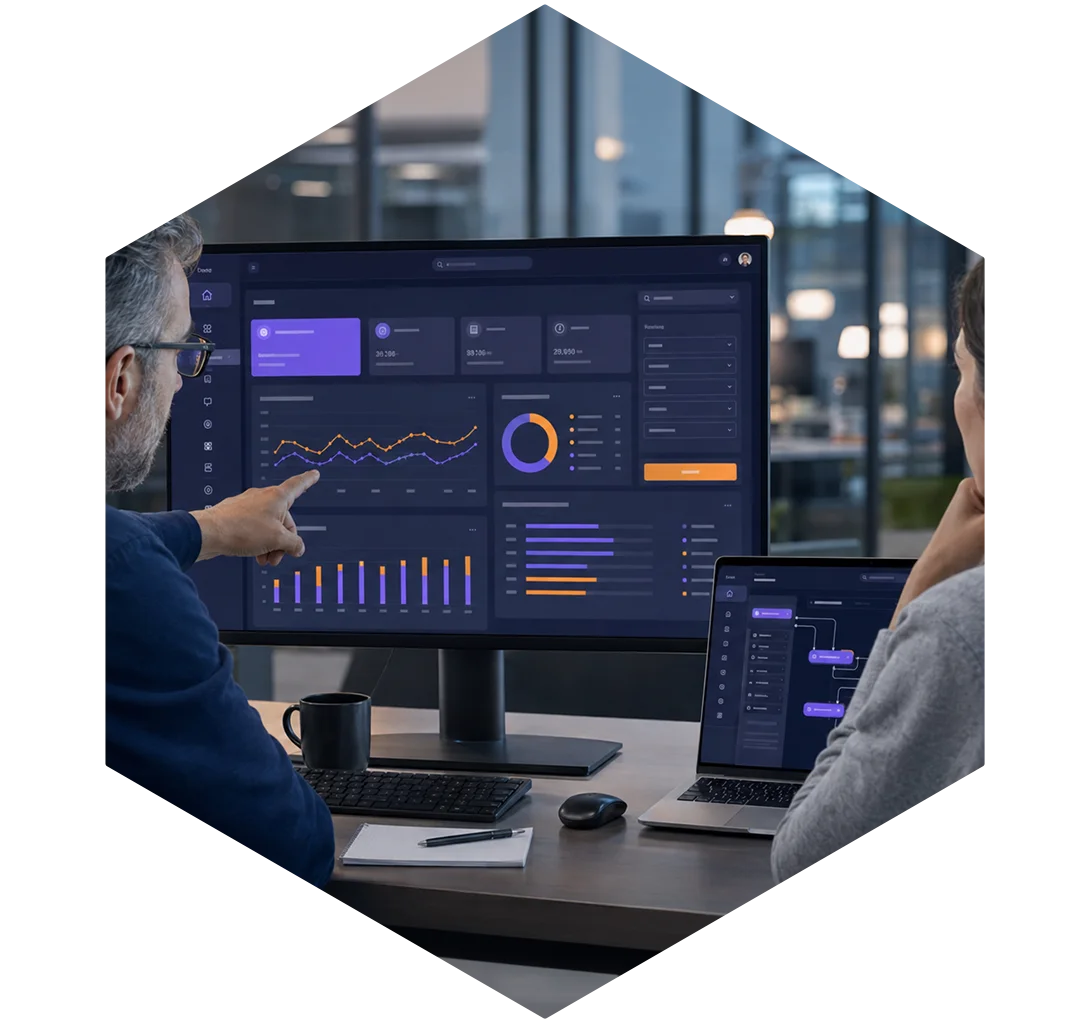
Softwarium moves recurring spreadsheet reporting into structured data models, automated refresh processes, reusable dashboards, and controlled workspaces.
The migration process covers:
source analysis
data cleaning
calculation review
metric validation
model design
dashboard recreation
access configuration
user testing
production rollout
documentation
Critical Excel calculations are traced and validated before the new reports enter production.

Power BI integration services
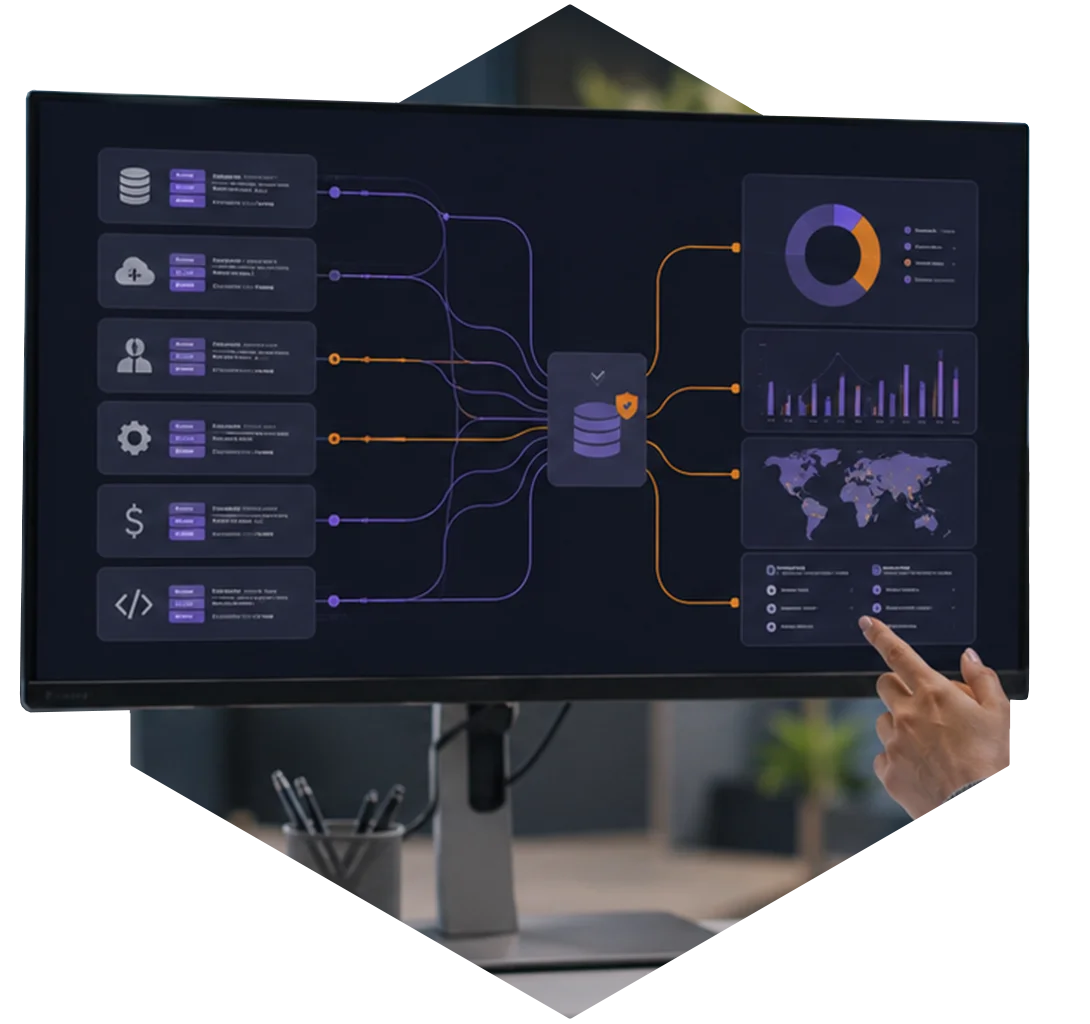
Softwarium connects Power BI to:
Azure Data Factory
Azure SQL
SQL Server
Azure Synapse
Dynamics 365
SharePoint
Salesforce
REST APIs
OData services
Excel and CSV files
third-party business systems
Integration work covers authentication, transformations, gateway configuration, refresh strategy, data quality, failure handling, monitoring, and access control.
Power BI performance and governance
Existing Power BI environments receive focused health checks across:
semantic-model structure
DAX performance
refresh duration
query folding
incremental refresh
workspace architecture
row-level security
access management
deployment processes
capacity usage
duplicated datasets
report adoption
naming standards
model documentation
The assessment produces a prioritised remediation plan tied to performance, reliability, governance, and AI readiness.
Prepare Power BI
for Copilot
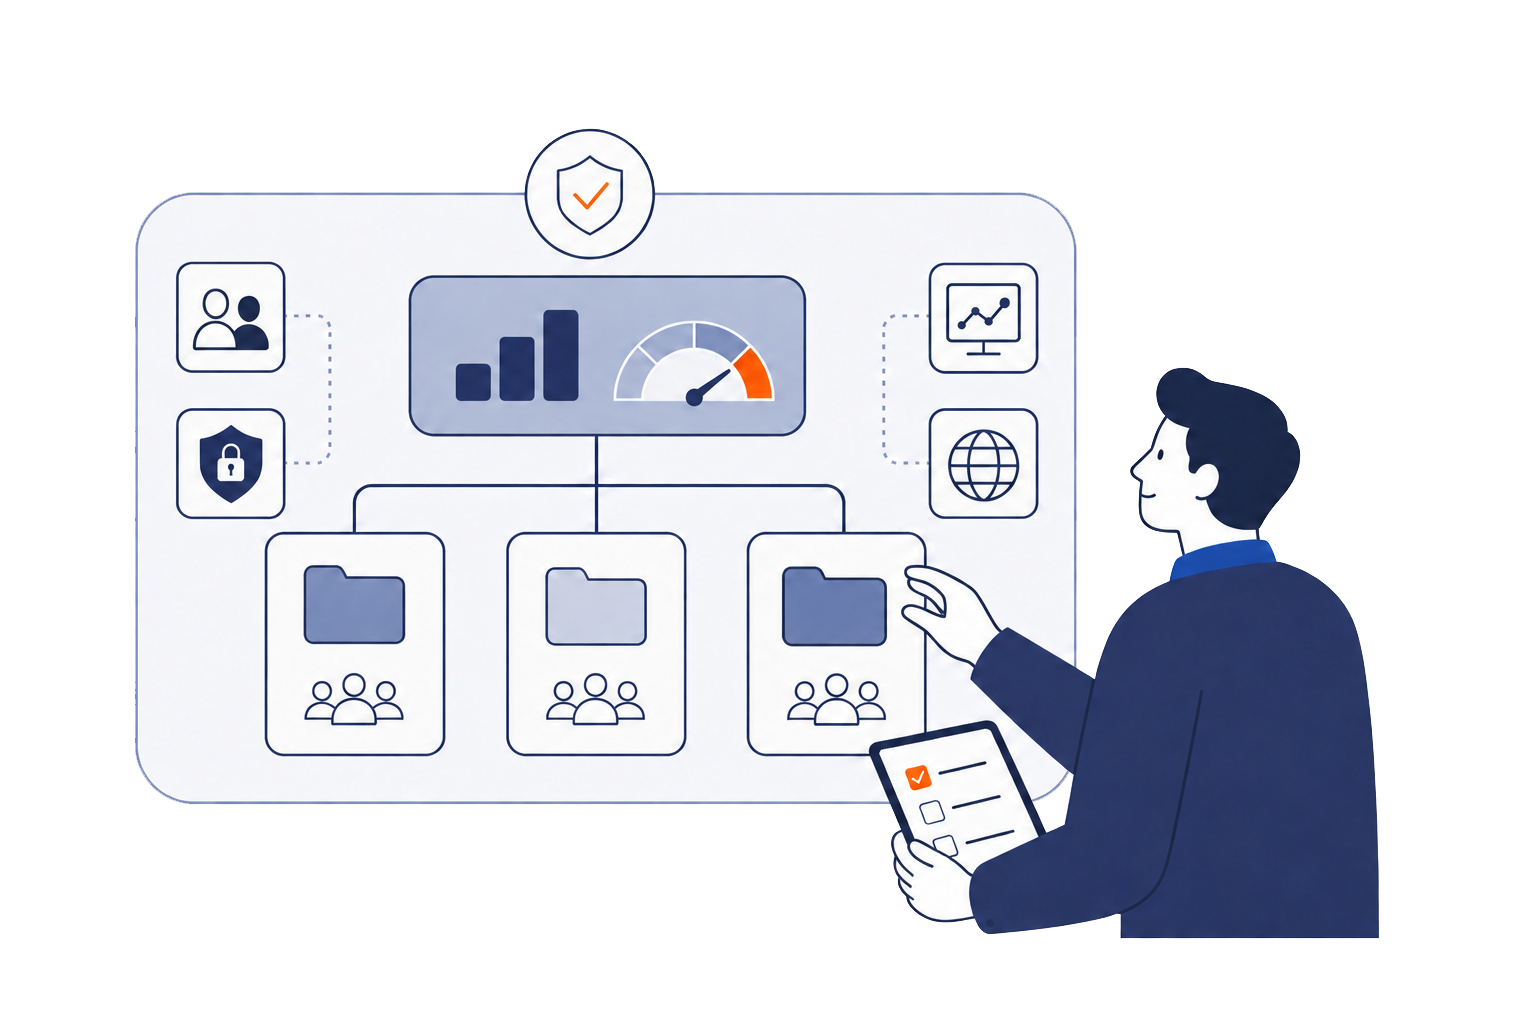
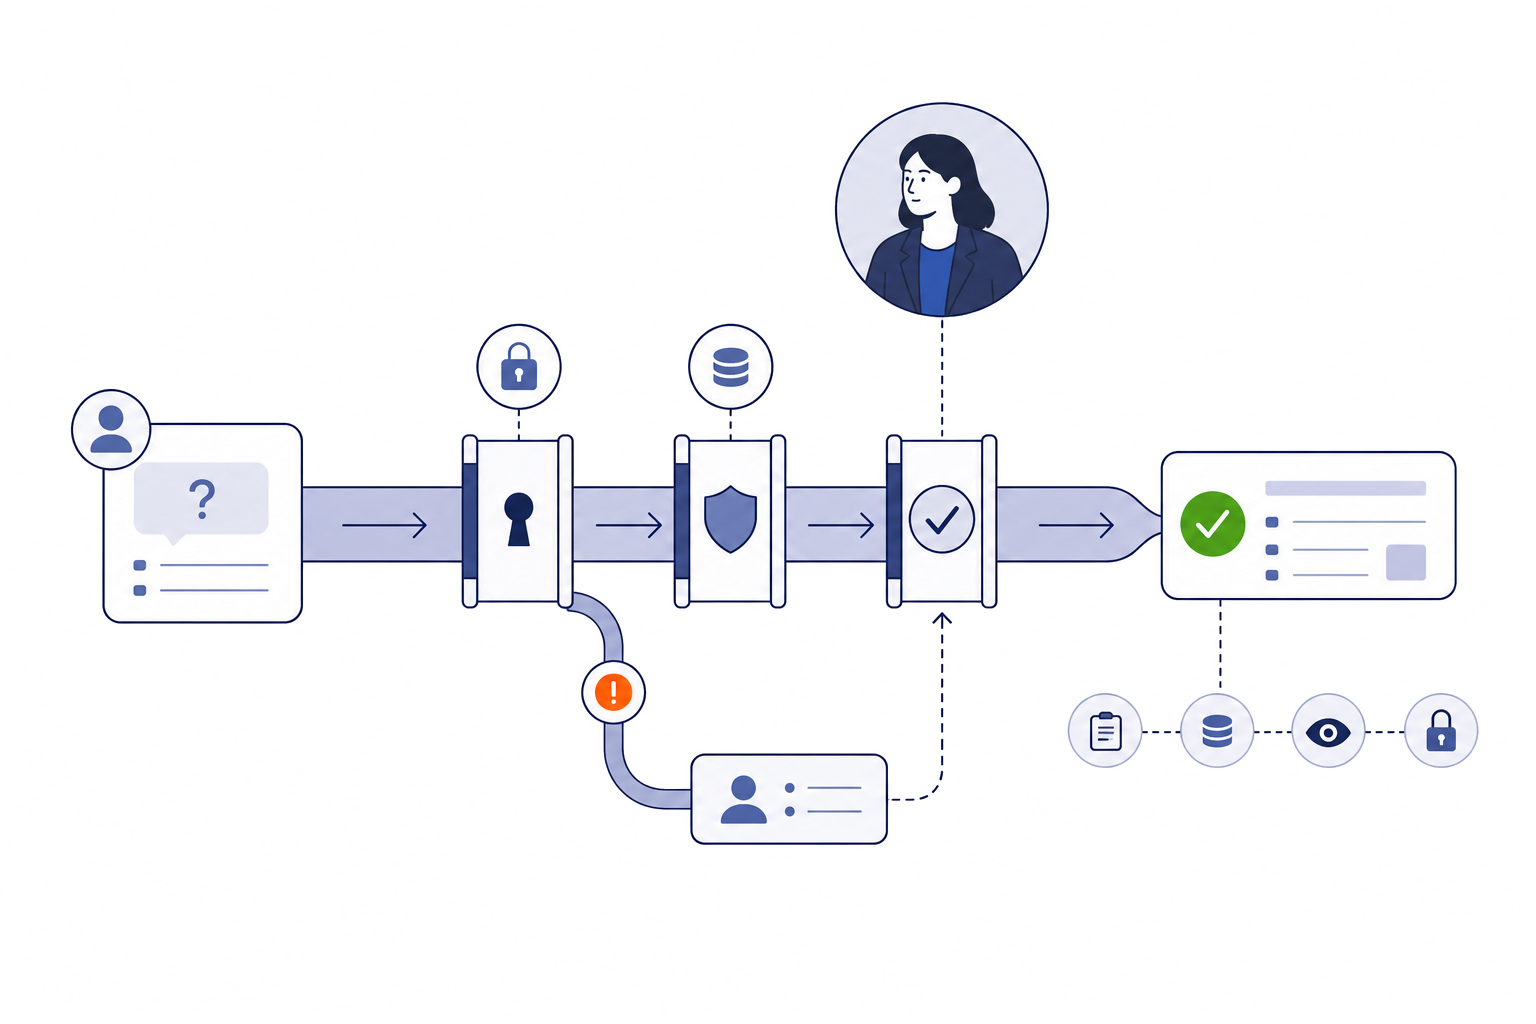
Copilot relies on eligible Microsoft capacity, tenant settings, workspace configuration, semantic-model quality, metadata, and security. Softwarium prepares each layer before rollout to business users.

1. Capacity, tenant, and workspace assessment
The assessment reviews:
eligible Microsoft capacity
Copilot tenant settings
workspace configuration
user roles and permissions
semantic-model permissions
monitoring requirements
security requirements
expected usage
capacity consumption
regional and compliance settings
Platform and access issues are resolved before model preparation and user testing.
2. Semantic-model assessment
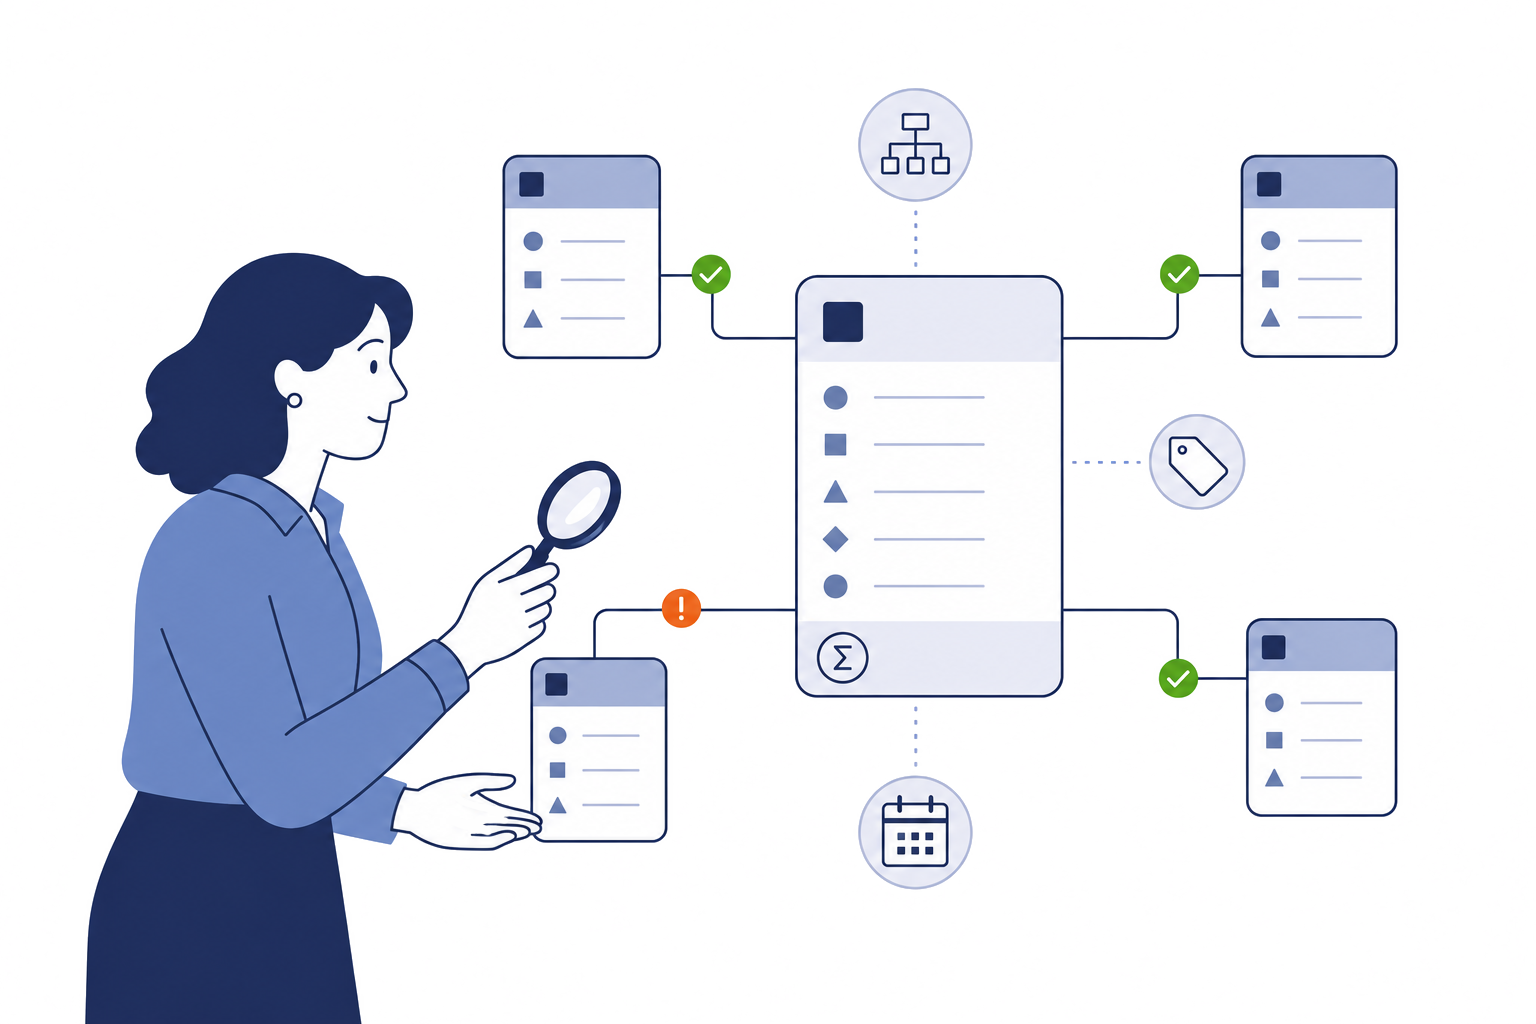
Softwarium reviews:
table and column names
relationships
DAX measures
model descriptions
business terminology
synonyms
date tables
hierarchies
data types
row-level security
object-level security
refresh logic
model size
schema complexity
Ambiguous fields, duplicated definitions, missing descriptions, and unsuitable relationships are corrected before Copilot testing.
3. Prep data for AI configuration
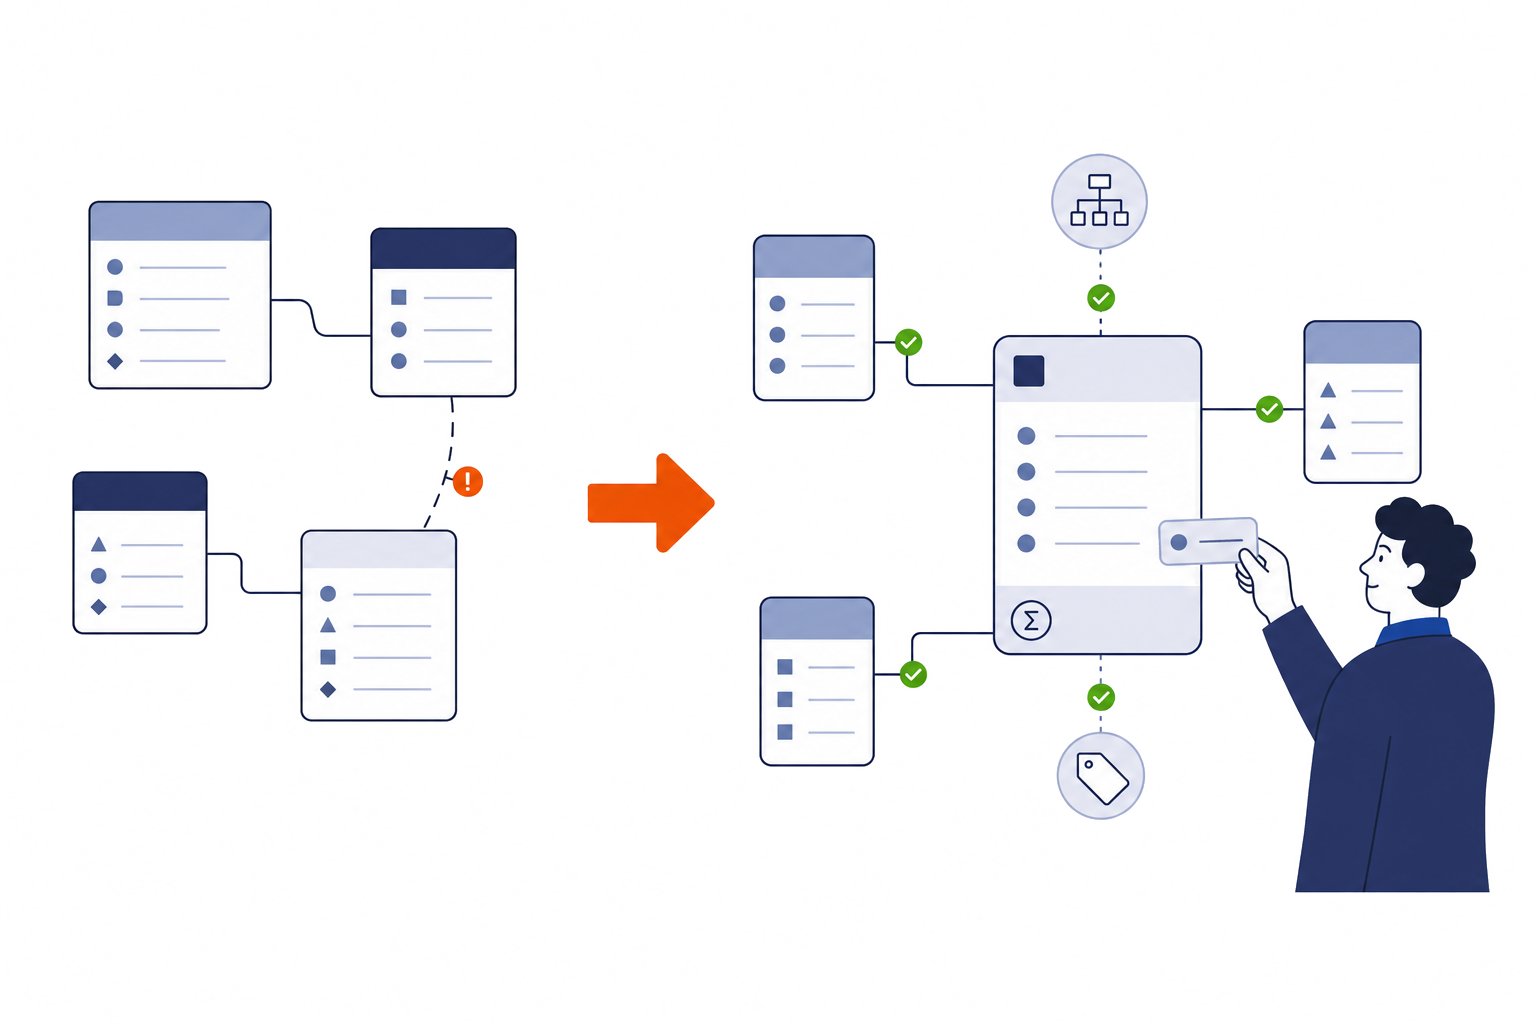
Softwarium configures the Power BI features that provide Copilot with business context.
AI Instructions
AI Instructions store organisational terminology, analytical guidance, business rules, and data context in the semantic model.
Copilot uses those instructions when interpreting user prompts and selecting relevant data.
Verified Answers
Verified Answers connect approved visual responses to defined trigger phrases.
Important and recurring questions receive consistent, human-approved answers with the relevant visual and filters.
AI Data Schemas
AI data schemas define the tables, fields, measures, and relationships Copilot should prioritise for a particular analytical context.
Focused schemas reduce ambiguity in large semantic models and keep Copilot aligned with approved business data.
4. Copilot testing
Softwarium tests Copilot against real questions from executives, analysts, and operational users.
Testing covers:
metric interpretation
business terminology
date ranges
time comparisons
filter behaviour
visual selection
measure selection
security boundaries
ambiguous prompts
unsupported questions
Verified Answer triggers
AI data schema behaviour
The Skill Picker supports focused testing of individual Copilot capabilities.
The semantic model receives Approved for Copilot status after technical testing, security validation, and business review.
5. Q&A migration review
Microsoft is retiring Power BI Q&A experiences in December 2026.
Upgrading a semantic model from the legacy Q&A tooling format to the Copilot tooling format permanently disables Q&A features for that model and its connected reports.
Existing Q&A visuals, synonyms, suggested questions, linguistic schemas, and report dependencies require review before migration.
Softwarium maps those dependencies, identifies affected reports, preserves relevant metadata, prepares replacement experiences, and plans the transition to Copilot tooling.
Connect Machine Learning Outputs to Power BI
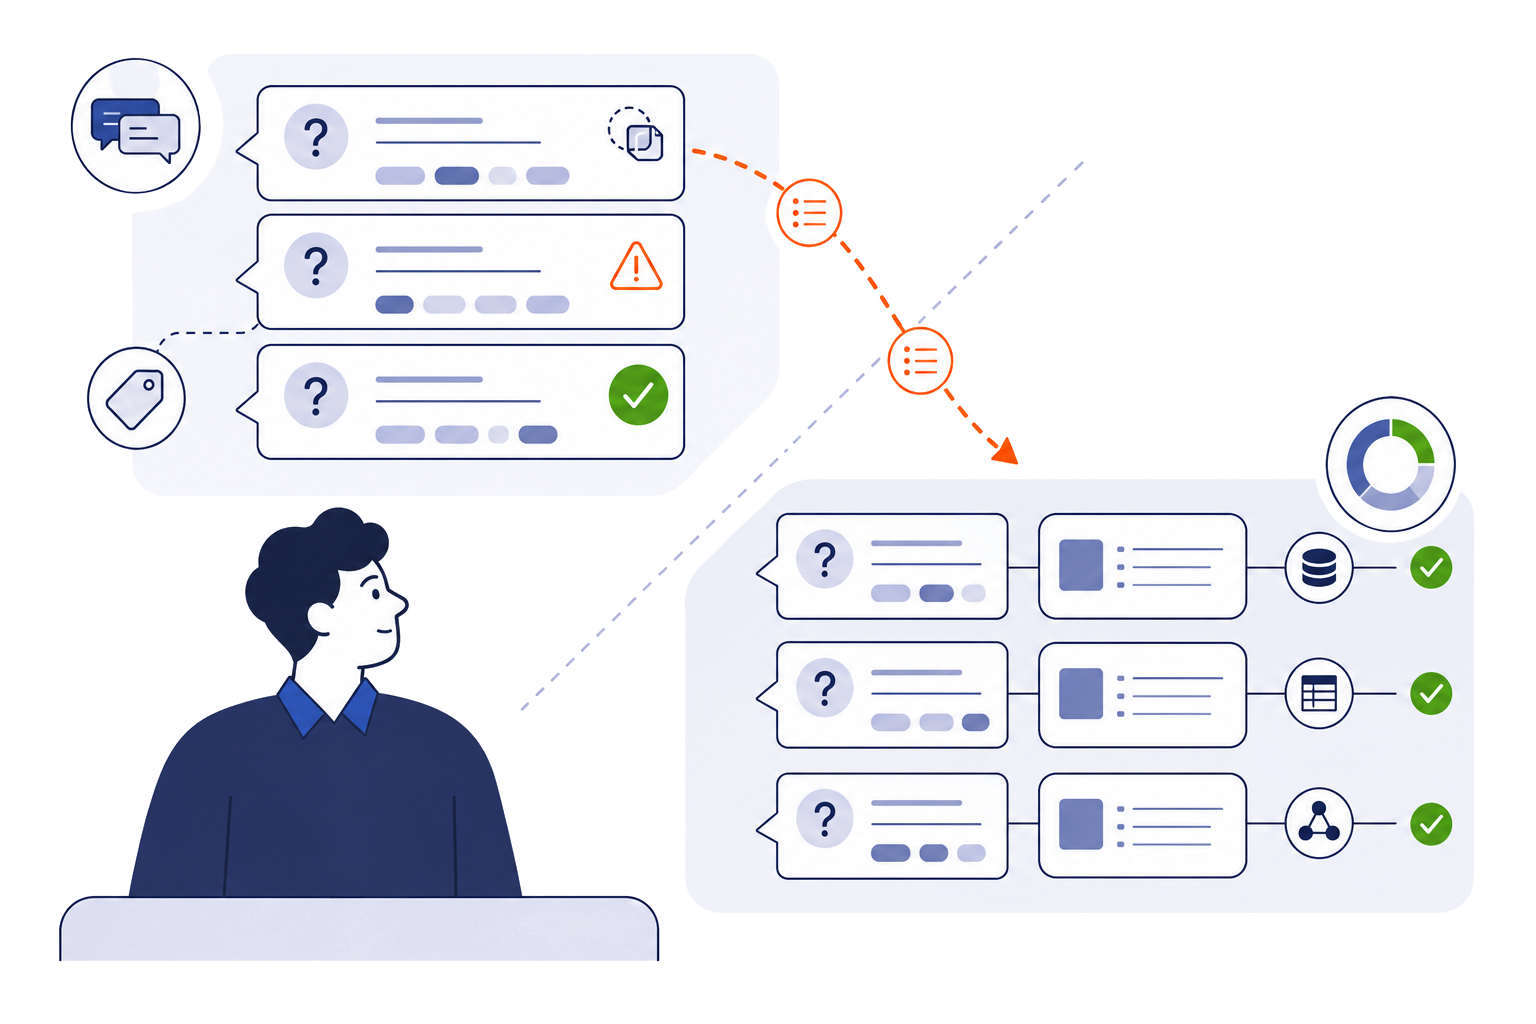
Machine learning models produce predictions, classifications, recommendations, anomaly scores, and risk indicators. Business users need each result in a governed reporting environment with the data and context required for review.
Softwarium connects model outputs through data pipelines, APIs, database tables, event streams, and scheduled processing. Power BI presents those outputs inside reports, dashboards, and embedded applications. A production reporting flow includes:
- the current model output
- the related source records
- confidence or probability values
- model timestamps
- data timestamps
- business thresholds
- exception status
- access controls
- refresh monitoring
- filters and segmentation
- historical comparisons
- processing failure alerts





Proven Power BI Delivery for Synovos
Synovos, now part of RS Integrated Supply, provides MRO supply-chain management services.
Softwarium delivered Power BI solutions for inventory reporting, large-dataset analysis, and organisation-wide report distribution.

 Excel-to-Power-BI inventory dashboard

Business problem
Synovos customers accessed inventory information through a large, multi-tab Excel spreadsheet. The format made analysis, maintenance, and distribution difficult as the reporting scope expanded.
.png)
Softwarium delivery
Softwarium migrated the reporting process into a Power BI inventory dashboard.
Users gained access to available inventory, original procurement dates, expected supply duration, open orders, item details, keyword-based product categorisation, custom report generation.

Operational result
Customers received a clearer inventory view from one reporting environment.
Synovos reduced repetitive reporting requests and gave users access to custom reports without coding.
 Power BI Embedded for 300MB reporting files

Business problem
Some Synovos Excel reporting files reached approximately 300MB.
Opening, downloading, analysing, and circulating those files consumed substantial time and restricted access to business information.
.png)
Softwarium delivery
Softwarium implemented Power BI Embedded with a capacity-based licensing approach aligned with the client’s reporting requirements.
Reports were published through Power BI Service and included personalised dashboards, custom visualisations, quick insights, natural-language queries, controlled report distribution.

Operational result
Large datasets became easier to analyse and share.
Management gained stronger visibility into sales quota attainment, lead volume, departmental performance, and patterns linked to business issues.
Why Companies Hire Power BI Developers Through Softwarium
Engineering depth behind every dashboard
Softwarium developers work across data architecture, integration, semantic modelling, security, performance, deployment, and maintenance.
This delivery scope supports stable reporting and limits the technical debt created by weak data models and isolated dashboards.

Microsoft ecosystem experience
Softwarium delivery spans Power BI, Azure, .NET, SharePoint, Dynamics 365, Power Platform, SQL Server, and Microsoft data services.
Power BI specialists work with the applications, APIs, identity systems, cloud services, and data pipelines surrounding the reporting environment.
Softwarium held Microsoft Gold competency status from 2010 until Microsoft retired the competency programme in 2022.

Documented Power BI Embedded delivery
The Synovos engagements provide direct evidence of:
- Excel migration
- Power BI Embedded implementation
- large-dataset reporting
- capacity-based distribution
- customised dashboards
- natural-language data access
- report personalisation
- long-term analytics support

Production-focused engineering
Softwarium developers test reports against source data, business calculations, security roles, refresh schedules, production data volumes, and user workflows.
Performance, access, monitoring, documentation, deployment, and maintenance remain part of the delivery scope.

Cross-functional delivery capacity
Softwarium brings more than 25 years of software engineering experience and a distributed team of more than 120 engineers.
Power BI specialists work alongside:
- data engineers
- Azure developers
- .NET developers
- QA engineers
- solution architects
- DevOps engineers
- delivery leads
This structure supports projects that extend beyond dashboard design into integration, cloud architecture, application development, testing, and long-term ownership.

Power BI
Engagement Models
IT staff augmentation
Add Power BI developers, DAX specialists, semantic-model experts, data engineers, or embedded-analytics developers to an existing team.
Best suited to:
- established BI teams with delivery backlogs
- internal teams that need specialist Power BI skills
- temporary capacity gaps
- performance remediation
- migration support
- Copilot preparation
- embedded analytics delivery

Co-managed Power BI engineering team
A co-managed team combines Softwarium specialists with the client’s product, data, engineering, and business teams.
The team structure includes Power BI development, data engineering, QA, architecture, and delivery management according to project scope.
Best suited to:
- continuous dashboard development
- multi-source analytics environments
- long-term BI ownership
- Azure-connected reporting
- embedded analytics products
- governance programmes
- ongoing Copilot refinement

Project-based Power BI delivery
Softwarium takes responsibility for a defined implementation with agreed scope, milestones, acceptance criteria, and handover requirements.
Projects include:
- Excel-to-Power-BI migration
- semantic-model redesign
- dashboard rebuild
- Power BI Embedded implementation
- source-system integration
- DAX optimisation
- performance remediation
- governance review
- Copilot readiness assessment
- Q&A migration planning

Power BI Delivery Process
 1
1Assessment
Softwarium reviews:
reporting requirements
business metrics
data sources
current models
security
governance
user groups
performance issues
integration dependencies
delivery objectives
Copilot-related assessments also cover capacity, tenant settings, workspaces, semantic models, metadata, AI preparation features, and Q&A dependencies. 2
2Architecture and build
The delivery team designs and implements:
DAX measures
the semantic model
the data flow
access rules
monitoring
refresh strategy
dashboards
integrations
deployment processes
workspace structure
 3
3Validation and release
Reports are tested against:
source data
approved calculations
security roles
refresh behaviour
expected data volumes
report performance
user scenarios
production access patterns
Business owners validate critical measures and workflows before production release. 4
4Support and evolution
Softwarium supports new reports, source systems, model changes, performance improvements, embedded features, governance requirements, and Copilot query refinement after launch.
Frequently Asked Questions
- What does a Power BI developer build?
A Power BI developer builds data connections, transformations, semantic models, DAX measures, reports, dashboards, refresh processes, access controls, deployment pipelines, and technical documentation.
Power BI Embedded specialists also work with APIs, authentication, capacity, customer access, and application integration.
- Does Power BI support machine learning outputs?
Yes. Power BI displays predictions, classifications, risk scores, recommendations, and anomaly indicators through connected data sources, APIs, pipelines, and analytical services.
Softwarium connects model outputs to the semantic model and builds the reporting experience around the users, data, and decisions involved.
- What does Copilot readiness consulting include?
The service covers:
- capacity and tenant settings
- workspace configuration
- semantic-model structure
- DAX measures
- field names
- descriptions
- relationships
- security
- AI Instructions
- Verified Answers
- AI data schemas
- Copilot testing
- Approved for Copilot review
- Q&A migration dependencies
- Does a Power BI licence include Copilot access?
Copilot access requires eligible Microsoft capacity, enabled tenant settings, suitable workspace configuration, user permissions, and supported licensing.
Softwarium reviews these requirements during the readiness assessment and identifies the platform, security, and administrative work required for rollout.
- Does Power BI replace Excel reporting?
Power BI provides the governed environment for recurring, shared, and controlled reporting.
Excel continues to support individual analysis, data exploration, and specialised spreadsheet work.
The Synovos engagement demonstrates this reporting model. Critical shared reports moved into Power BI, giving customers and managers faster access to structured inventory and organisational data.
- How does Power BI Embedded licensing work?
The licensing structure follows the embedding scenario, capacity, audience, identity model, and distribution requirements.
App-owned and user-owned embedding use different authentication and end-user licensing models.
Softwarium reviews these factors before selecting the Embedded architecture.
- How long does a Power BI project take?
The delivery schedule follows the number of data sources, data quality, semantic-model complexity, report count, security requirements, integrations, and validation scope.
The assessment defines the architecture, milestones, dependencies, acceptance criteria, and release plan.
- How much does it cost to hire Power BI developers?
Cost follows the engagement model, specialist roles, seniority, duration, and project scope.
IT staff augmentation is priced around engineering capacity. Co-managed teams are structured around ongoing delivery ownership. Project-based work is estimated against a defined implementation and acceptance criteria.
Related Expertise

Hire Azure Developers
Build the Azure data pipelines, databases, cloud services, identity architecture, and machine learning infrastructure that feed Power BI.

Hire AI Developers
Develop machine learning models, AI-assisted workflows, RAG applications, data-processing pipelines, and production AI integrations.

Hire Power Apps Developers
Connect reporting and operational actions through Power Apps, Power Automate, and Power BI.
Hire Power BI Developers
Who Build Trusted Analytics
Softwarium builds Power BI dashboards, semantic models, embedded analytics, data integrations, and Copilot-ready reporting environments.
Move critical reporting out of disconnected files. Give business users consistent metrics. Prepare semantic models for AI-assisted analysis. Connect machine learning outputs to governed operational reports.