What is Power BI and What You Need to Know About It
Move past traditional PowerPoint to embrace Microsoft Power BI, a dynamic business intelligence platform. This tool is changing how companies visualize data and make decisions.

What is Power BI and What You Need to Know About It
What is Power BI?
Microsoft Power BI is a data visualization and business intelligence platform. It connects to numerous data sources, both cloud-based and on-premises. With Power BI, customize your reports easily with various formats and themes, making data analysis straightforward and effective.
Power BI Benefits
Business leaders are increasingly turning to Power BI, and it's easy to see why: its capacity to handle and analyze large volumes of data is unparalleled.
Let's consoder a real scenario: opening a 300MB CSV file can be a daunting task for many computers, limiting your analytical capabilities. Power BI changes the game entirely. It effortlessly compresses and visualizes substantial data sets from Excel, text, and CSV files, making what seemed impossible in Excel a reality. In fact, all of your files can be stored, connected and analyzed while taking up about 50MB.
The versatility of Power BI extends further, integrating seamlessly with a suite of Microsoft tools like SharePoint, Dynamics 365, and Office 365. Power BI also works with non-Microsoft products such as Salesforce, Google Analytics, and SAP, broadening the scope of your data analysis. This makes it an ideal tool for delving deep into your CRM to identify new business opportunities, trends and make predictions.
Its intuitive design makes Power BI easier and more efficient to use than Excel or any other analysis tools you might be accustomed to.

Save on Labor Costs With Microsoft Power BI
The cost of doing business no longer includes spending countless hours pulling data out of a database and then converting it into comprehensive dashboards and reports.
Power BI streamlines these processes with Power Query, an add-in available in Excel. From filtering data from a range of sources to modifying layouts before importing into Excel, Power BI significantly reduces time and effort, allowing you to focus on strategic analysis.
Improved Forecasting
With PowerBI, you can perform multivariable modeling and analysis with large volumes of data. Visualize static reports as well as dynamic projections, enabling you to explore the impact of various scenarios over time. It helps in analyzing trends and making informed predictions, essential for strategic planning and presenting to stakeholders.
Improved Overall Performance
Power BI serves as a central hub for your data, turning it into actionable insights. Use Power BI to get a comprehensive view of your business's health. Whether it's combining production and distribution data or analyzing resource utilization, using Power BI offers an in-depth analysis - enabling data engineers and business analysts to spot performance trends and identify areas for improvement.
Power BI is a Must in the Modern Business Landscape
Microsoft Power BI is a versatile and powerful tool that eliminates certain manual tasks, ideal for anyone from data scientists to business users. It streamlines the process of data analysis and visualization, offering customizations to suit varied business needs. With using Power BI, businesses can turn data into a strategic asset, paving the way for growth and innovation.
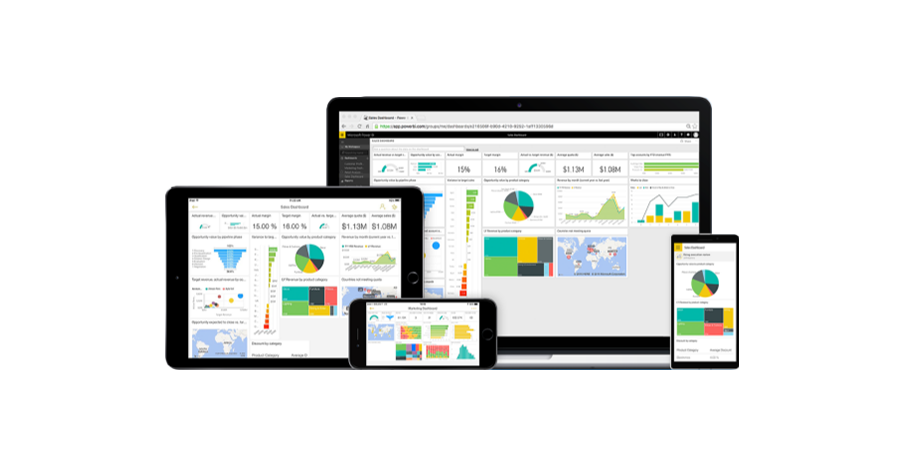
Whether it's Power BI Desktop for individual analysis or Power BI Service for enterprise-level data management, this tool offers solutions tailored to every need. Its compatibility with mobile devices through Power BI Mobile apps ensures that real-time analytics and insights are always at your fingertips. As Microsoft continually enhances Power BI with new features and updates, regularly checking the latest improvements ensures you leverage its full potential.
Don't miss out on exploring the smart CMS packed with incredible marketing automation tools that will revolutionize your digital strategy.
How to Use Power BI
Harness the full potential of Power BI by delving into advanced features:
- Power Query: Utilize Power BI’s Power Query tool for complex data transformation and preparation tasks.
- Collaboration Tools: Enhance collaboration using integrated Microsoft services like Teams and by sharing dashboards, setting up automated data refreshes, and distributing insights securely.
- Customization and Interactivity: Make your reports and dashboards more interactive and user-friendly with customization options. Adjust colors, fonts, layouts, and add interactive elements like filters.
- AI-Powered Analytics: Explore advanced features like Quick Insights for AI-powered analytics, providing deep and actionable insights.
- Continuous Learning and Organization: Stay abreast of new features and functionalities with Power BI’s regular updates. Keep your projects organized by clearly naming reports and dashboards and grouping related items together.
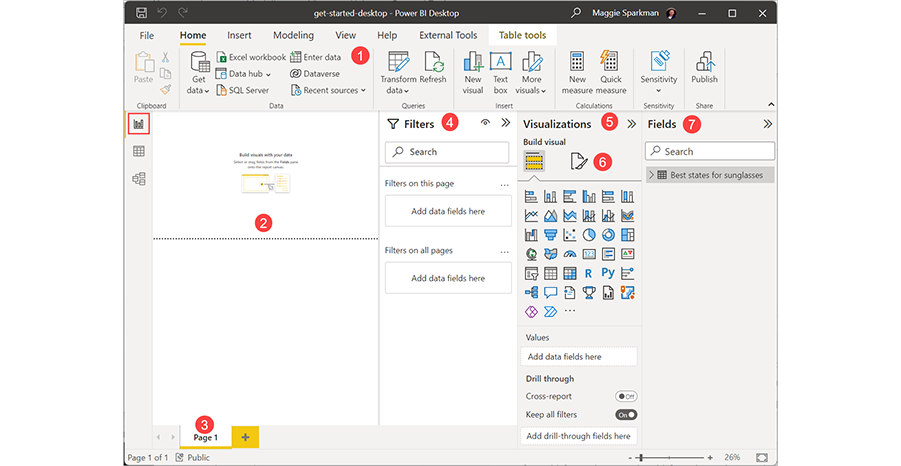
Getting Started with Power BI Desktop
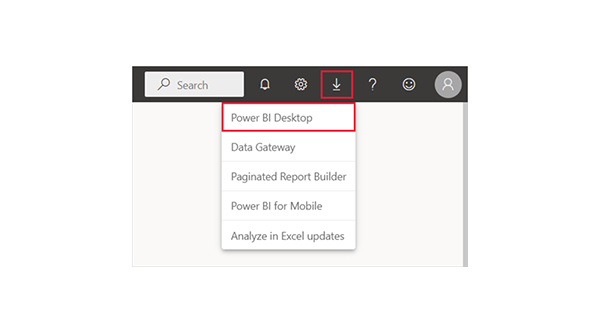
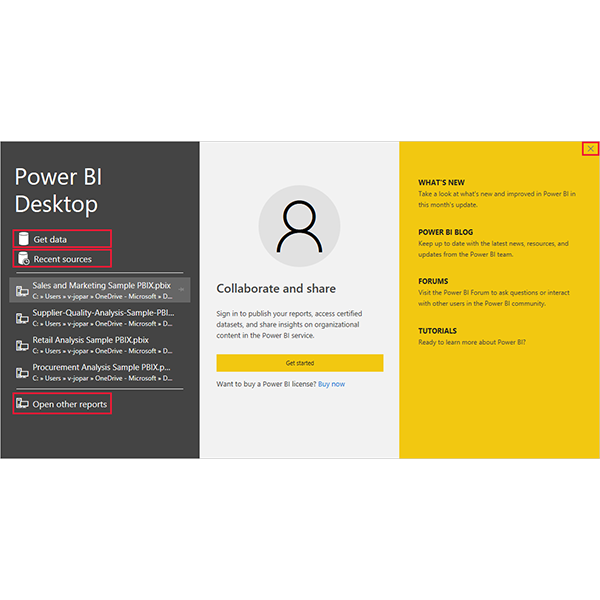
Power BI Desktop is a robust platform for creating reports and data models. Kickstart your Power BI journey by downloading the application from the Microsoft Store and signing in with your Microsoft account. If you don't have an account, take a moment to create one.
Setting Up and Connecting to Data Sources
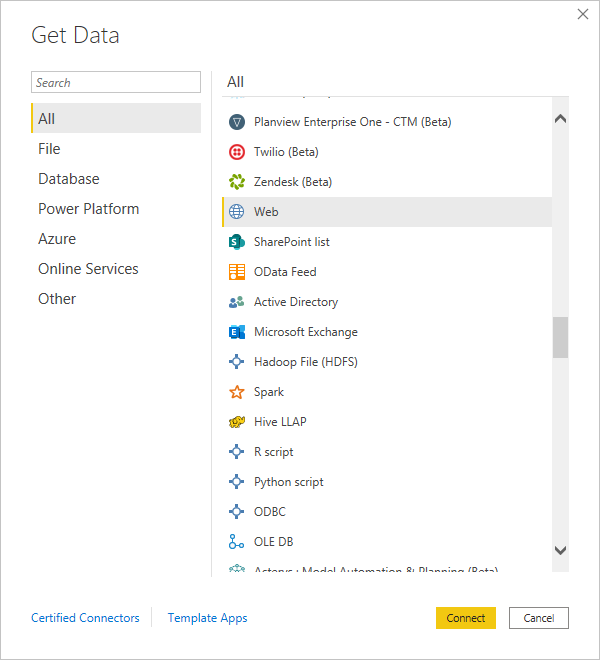
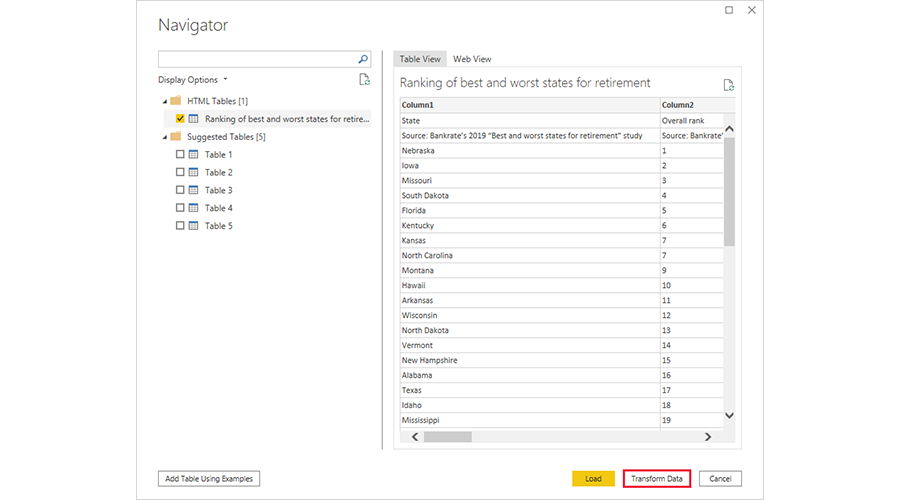
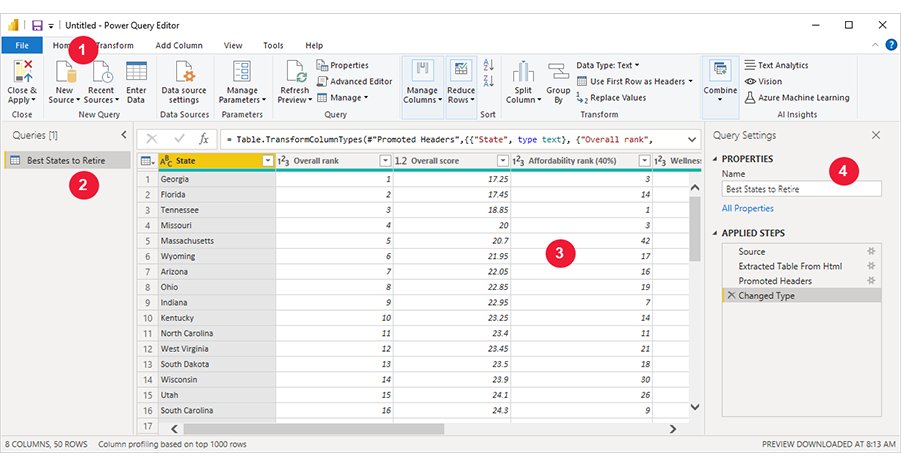
Once Power BI Desktop is installed, connect to data sources including Excel files, SQL databases, and web services. Use the ‘Get Data’ option to access your desired data source. Follow the intuitive prompts to import and transform your data.
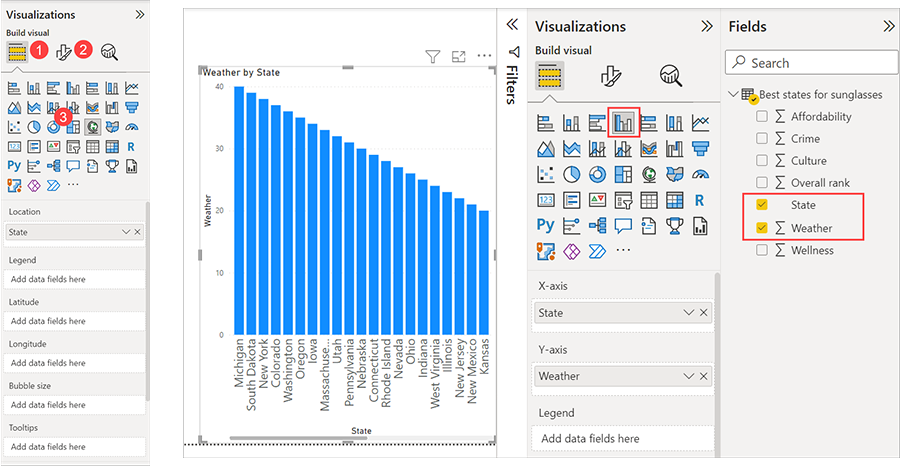
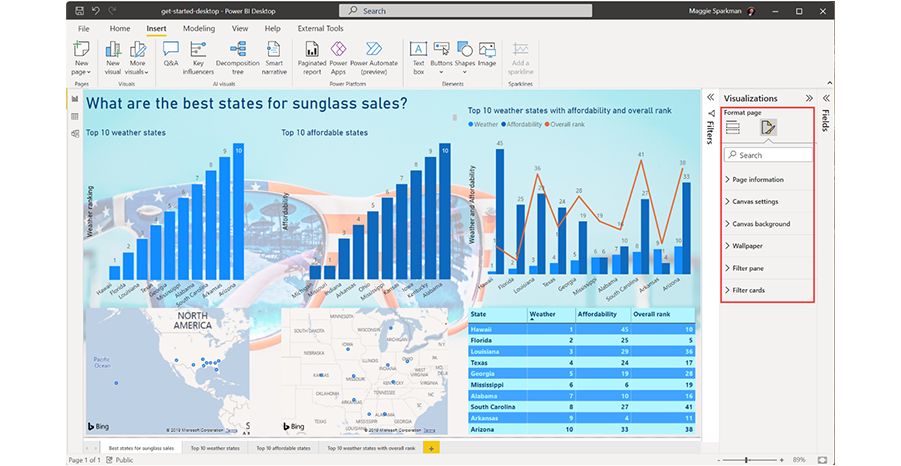
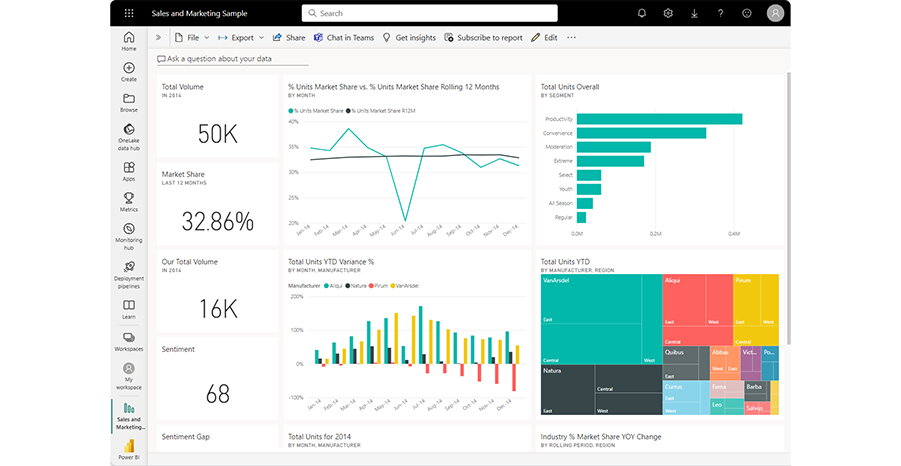
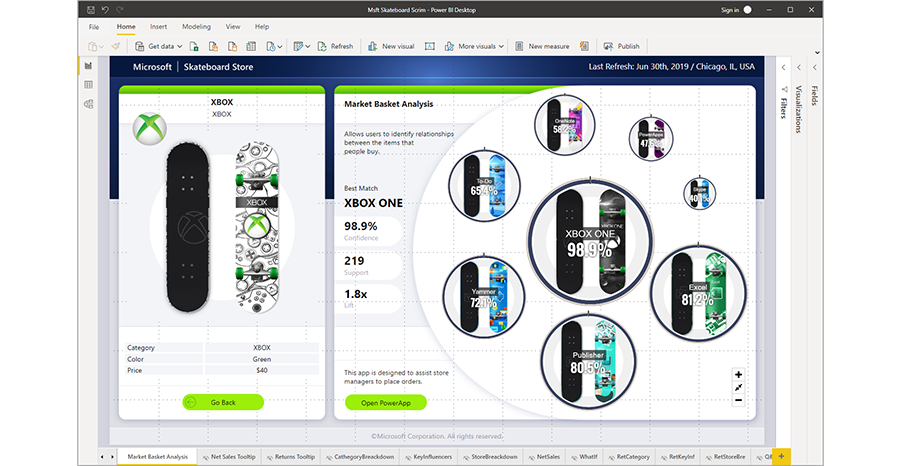
Creating Reports and Dashboards
Turn your data into insightful reports by adding data to the report canvas from the ‘Fields’ pane. Choose from a variety of visualizations such as charts, graphs, maps, and tables to make your data compelling and understandable. Customize these visualizations using filters and other interactive elements.
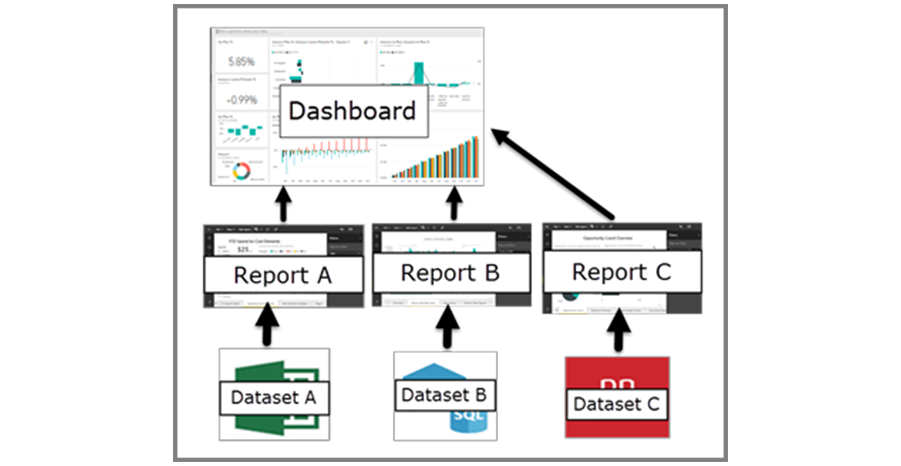
In Power BI Service (online), enhance your reporting by creating dashboards. Pin visuals from your reports to dashboards for a consolidated view of key metrics. Organize and resize these visuals to craft an informative and engaging dashboard.
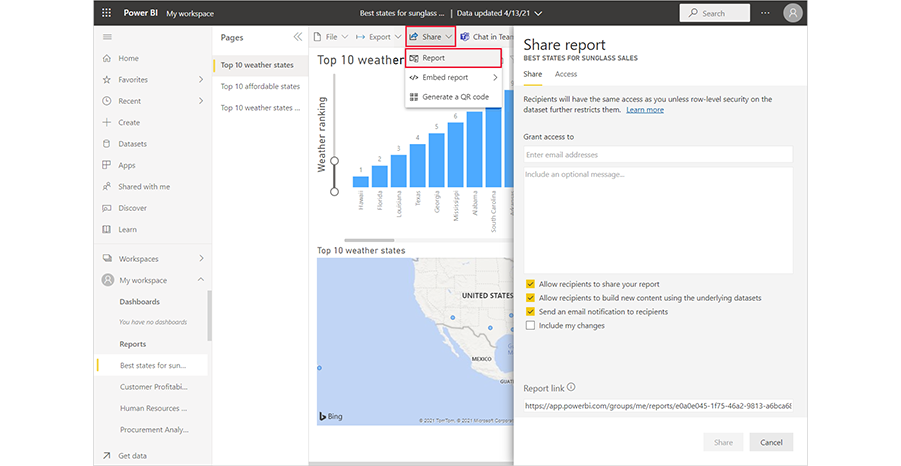
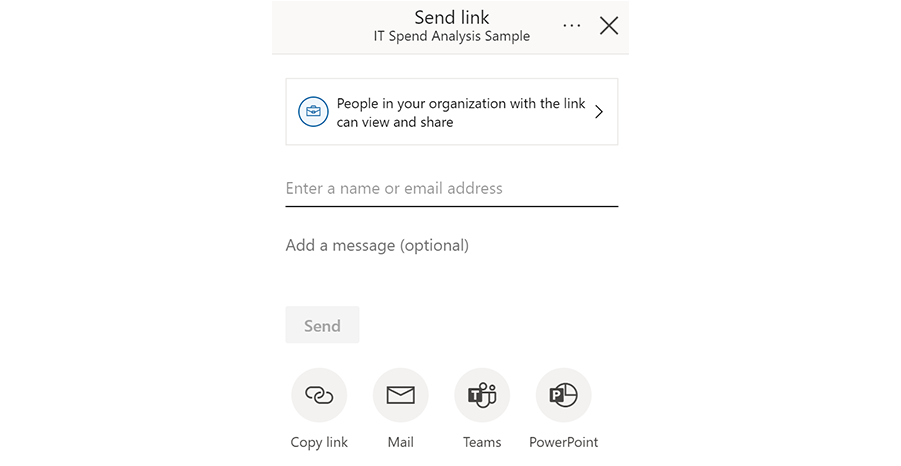
Publishing, Sharing, and Accessing Reports
Publish your masterfully created reports from Power BI Desktop to the Power BI Service with the ‘Publish’ button. Share your insights securely within your organization by granting access to your reports and dashboards.
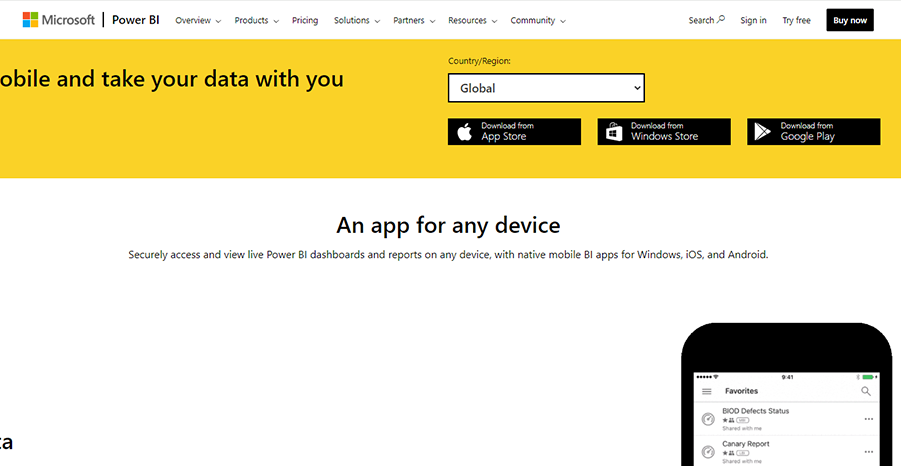
Utilize the Power BI Mobile apps on Windows, iOS, and Android devices to access your reports on the go, ensuring decision-making is data-driven, anytime and anywhere.
Power BI Pricing
What are the versions of Power BI? Each of them offers unique features, from basic data visualization in the free version to advanced analytics and larger data capacity in the Pro and Premium versions.

Power BI Free vs Pro vs Premium
-
Power BI Free offers basic data visualization and report creation functionalities. It's ideal for individuals or small teams who need to create and view reports but don't require collaboration tools.
-
Microsoft Power BI Pro, available through a monthly subscription, is suited for businesses that need more collaboration and sharing capabilities. It includes access to the Power BI Service for publishing reports and sharing dashboards with others in the organization.
-
Power BI Premium provides dedicated cloud resources, larger data capacities, and advanced analytics capabilities. It's designed for large enterprises that require extensive data modeling and analytics features. The pricing varies based on the capacity needed and the number of users.
-

Choosing the Right Power BI License
Evaluate your organization’s size, data analysis needs, and collaboration requirements to choose the right Power BI version.
For individual users or small teams with limited data collaboration needs, the Free or Pro versions are generally sufficient.
Large organizations with complex data analysis needs and a requirement for dedicated resources will benefit from using Power BI Premium.

Additional Costs and Considerations
Power BI Embedded and Power BI Report Server are additional offerings for businesses with specific needs like embedding analytics in their applications or maintaining on-premises report servers.
Consider additional costs like Power BI Embedded costs or expenses for custom development if you need specific features not available out-of-the-box.
Transform Your Data Analysis with Softwarium
FAQs:
1. What is Power BI?
Power BI is a business intelligence platform by Microsoft that enables data visualization and reporting, making it easier to create business insights from various data sources.
2. How does Power BI integrate with other Microsoft products?
Power BI integrates seamlessly with Office 365, Dynamics 365, and SharePoint, enhancing its data visualization and reporting capabilities.
3. What are the differences between Power BI Pro and Premium?
Power BI Pro is designed for individual users or small teams, offering basic data visualization and sharing features. Power BI Premium caters to larger organizations with advanced analytics, larger data processing capabilities, and dedicated cloud resources.
4. Can I use Power BI for free?
Yes, Power BI offers a free version with basic data visualization and reporting features, suitable for individuals or small businesses with basic data analysis needs.